Q and K: What's the difference?
Finding the way to the equilibrium state
Consider a simple reaction such as the gas-phase synthesis of hydrogen iodide from its elements: H2 + I2 → 2 HI.
Suppose you combine arbitray quantities of H2, I2 and HI.
Will the reaction create more HI, or will some of the HI be consumed as the system moves toward its equilibrium state?
The concept of the reaction quotient, which is the focus of this short lesson, makes it easy to predict what will happen.
In the previous section we defined the equilibrium expression for the generalized reaction
a A + b B → c C + d D
as 
In the general case in which the concentrations can have any arbitrary values (including zero), this expression is called the reaction quotient (the term equilibrium quotient is also commonly used.) and its value is denoted by Q (or Qc or Qp if we wish to emphasize that the terms represent molar concentrations or partial pressures.) If the terms correspond to equilibrium concentrations, then the above expression is called the equilibrium constant and its value is denoted by K (or Kc or Kp.)
The value of Q in relation to K serves as an index how the composition of the reaction system compares to that of the equilibrium state, and thus it indicates the direction in which any net reaction must proceed.
For example, if we combine the two reactants A and B at concentrations of 1 mol L–1 each, the value of Q will be 0÷1=0. The only possible change is the conversion of some of these reacants into products. If instead our mixture consists only of the two products C and D, Q will be indeterminately large (1÷0) and the only possible change will be in the reverse direction.
By simple application of the le Châtelier principle, it is easy to see that the ratio of Q/K immediately tells us whether, and in which direction, a net reaction will occur as the system moves toward its equilibrium state. A schematic view of this relationship is shown for each of the three cases
Q > K, Q = K, and Q < K.
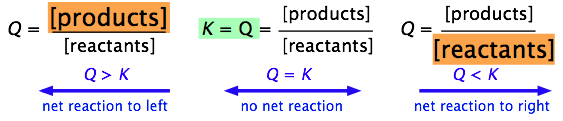
More formally, we can simply use the Q/K ratio to define these three possible condtions:
| Q/K | |
| > 1 | Product concentration too high for equilibrium; net reaction proceeds to left. |
| = 1 | System is at equilibrium; no net change will occur. |
| < 1 | Product concentration too low for equilibrium; net reaction proceeds to right. |
It is very important that you be able to work out these relations for yourself, not by memorizing them, but from the definitions of Q and K.
The formal definitions of Q and K are quite simple, but they are of limited usefulness unless you are able to relate them to real chemical situations. The following diagrams illustrate the relation between Q and K from various standpoints. Take some time to study each one carefully, making sure that you are able to relate the description to the illustration.
Example 1: Dissociation of dinitrogen tetroxide
For the reaction N2O4 → 2 NO2 , Kc = 0.0059 at 298K.
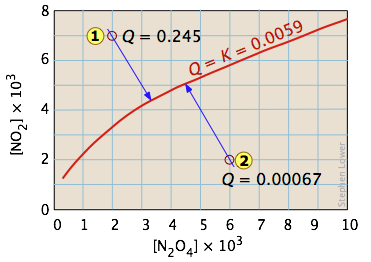 This equilibrium condition is represented by the red curve that passes through all points on the graph that satisfy the requirement that Q = [NO2]2 / [N2O4] = 0.0059 .
There are of course an infinite number of possible Q's of this system within the concentration boundaries shown on the plot. Only those points that fall on the red line correspond to equilibrium states of this system (those for which Q = K ). The line itself is a plot of [NO2] that we obtain by rearranging the equilibrium expression
[NO2] = ([N2O4]K)0.5.
If the system is initially in a non-equilibrium state, its composition will tend to change in a direction that moves it to one that is on the red line.
Two such non-equilibrium states are shown. The state indicated by ![]() has
has
Q > K, so we would expect a net reaction that reduces Q by converting some of the NO2 into N2O4; in other words, the equilibrium "shifts to the left". Similarly, in state ![]() , Q < K, indicating that the forward reaction will occur.
, Q < K, indicating that the forward reaction will occur.
The blue arrows in the above diagram indicate the successive values that Q assumes as the reaction moves closer to equilibrium. The slope of the arrows reflects the stoichiometry of the equation. In this case, one mole of reactant yields two moles of products, so the slopes have an absolute value of 2:1.
Example 2: Phase-change equilibrium
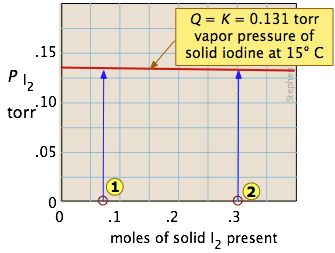 One of the simplest equilibria we can write is that between a solid and its vapor. In this case (as will be explained more fully in the next lesson), the equilibrium constant is just the vapor pressure of the solid. Thus for the process
I2(s) → I2(g)
all possible equilibrium states of the system lie on the horizontal red line and is independent of the quantity of solid present (as long as there is at least enough to supply the relative tiny quantity of vapor.) So adding various amounts of the solid to an empty closed vessel (states ![]() and
and ![]() ) causes a gradual buidup of iodine vapor. Because the equilibrium pressure of the vapor is so small, the amount of solid consumed in the process is negligible, so the arrows go straight up and all lead to the same equilibrium vapor pressure.
) causes a gradual buidup of iodine vapor. Because the equilibrium pressure of the vapor is so small, the amount of solid consumed in the process is negligible, so the arrows go straight up and all lead to the same equilibrium vapor pressure.
Example 3: Heterogeneous chemical reaction
The decomposition of ammonium chloride is a common example of a heterogeneous (two-phase) equilibrium. Solid ammonium chloride has a substantial vapor pressure even at room temperature:
NH4Cl(s) → NH3(g) + HCl(g)
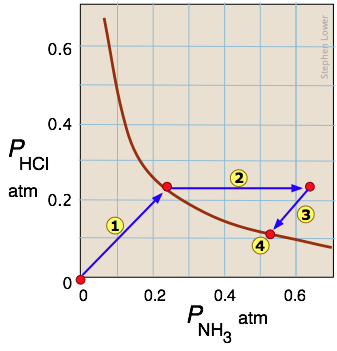
Arrow ![]() traces the states the system passes through when solid NH4Cl is placed in a closed container. Arrow
traces the states the system passes through when solid NH4Cl is placed in a closed container. Arrow ![]() represents the addition of ammonia to the equilibrium mixture; the system responds by following the path
represents the addition of ammonia to the equilibrium mixture; the system responds by following the path ![]() back to a new equilibrium state
back to a new equilibrium state ![]() which, as the Le Châtelier principle predicts, contains a smaller quantity of ammonia than was added. The unit slopes of the paths
which, as the Le Châtelier principle predicts, contains a smaller quantity of ammonia than was added. The unit slopes of the paths ![]() and
and ![]() reflect the 1:1 stoichiometry of the gaseous products of the reaction.
reflect the 1:1 stoichiometry of the gaseous products of the reaction.